Tabular display
The tabular display panel is a read-only panel for arbitrary data.

Column types
The panel is able to recognize certain data types: scalars, lists, and strings. Scalars are any real numbers, lists are number sequences with a particular syntax, and everything else is considered to be a string.
Lists are of the form:
[(number, number), (number, number), ...]
This is the format used by the Data capture panel for export of list data.
Data filters
Data filters allow the user to narrow a large dataset into a smaller one, potentially making visualization simpler and all operations faster.
Tip
If there are already filters which have transformed an originally large dataset into a small one, adding a new filter is a very fast operation. However, removing or editing any filter will be as slow as applying the first filter, since the original dataset must be re-filtered in its entirety.
Syntax
Filters are provided as Python-like expressions on a per-column basis. All occurrences of x are internally replaced with an identifier for the selected column, and the remainder of the expression is left intact. Thus, the user is free to use as much creativity as desired when constructing filters.
Valid comparison operators include: < (less than), <= (less than or equal to), == (equal to), != (not equal to), >= (greater than or equal to), > (greater than). Comparisons may be grouped with: and (both expressions must be true), or (at least one expression must be true); and negated with: not (expression must be false).
Tip
The Python equality comparison operator is two equal signs (==), not a single equal sign (=). Using the latter in place of the former may generate a generic “invalid syntax” error.
Examples
All examples assume the following initial dataset:
| Time (s) | field (mT) | port out (V) | port in (V) |
|---|---|---|---|
| 0 | 1.0 | -5.0 | -0.0100000004 |
| 0.251417 | 1.0 | -4.0 | -0.0100000008 |
| 0.512650 | 1.0 | -3.0 | -0.0100000016 |
| 0.766408 | 1.0 | -2.0 | -0.0100000032 |
| 1.024776 | 1.0 | -1.0 | -0.0100000064 |
| 1.300688 | 3.0 | -5.0 | -0.0100000128 |
| 1.605982 | 3.0 | -4.0 | -0.0100000256 |
| 1.876083 | 3.0 | -3.0 | -0.0100000512 |
| 2.145252 | 3.0 | -2.0 | -0.0100001024 |
| 4.211317 | 3.0 | -1.0 | -0.0100002048 |
| 4.523829 | 5.0 | -5.0 | -0.0100004096 |
| 4.788892 | 5.0 | -4.0 | -0.0100008192 |
| 5.056252 | 5.0 | -3.0 | -0.0100016384 |
| 5.353702 | 5.0 | -2.0 | -0.0100032768 |
| 5.627074 | 5.0 | -1.0 | -0.0100065536 |
Time selection
Select only the rows that fit within a slice of time.
The filter:
| Column: | Time (s) |
| Filter: | x > 1.0 and x < 5.0 |
results in:
| Time (s) | field (mT) | port out (V) | port in (V) |
|---|---|---|---|
| 1.024776 | 1.0 | -1.0 | -0.0100000064 |
| 1.300688 | 3.0 | -5.0 | -0.0100000128 |
| 1.605982 | 3.0 | -4.0 | -0.0100000256 |
| 1.876083 | 3.0 | -3.0 | -0.0100000512 |
| 2.145252 | 3.0 | -2.0 | -0.0100001024 |
| 4.211317 | 3.0 | -1.0 | -0.0100002048 |
| 4.523829 | 5.0 | -5.0 | -0.0100004096 |
| 4.788892 | 5.0 | -4.0 | -0.0100008192 |
Dimensionality reduction
Reduce an entire dimension to a single point.
This allows for plots which would otherwise be impossible. For example, “port in (V)” vs “port out (V)” cannot be plotted since “port in (V)” is not a function of “port out (V)”.
The filter:
| Column: | field (mT) |
| Filter: | x == 3.0 |
results in:
| Time (s) | field (mT) | port out (V) | port in (V) |
|---|---|---|---|
| 1.300688 | 3.0 | -5.0 | -0.0100000128 |
| 1.605982 | 3.0 | -4.0 | -0.0100000256 |
| 1.876083 | 3.0 | -3.0 | -0.0100000512 |
| 2.145252 | 3.0 | -2.0 | -0.0100001024 |
| 4.211317 | 3.0 | -1.0 | -0.0100002048 |
It becomes possible to plot “port in (V)” vs “port out (V)” at a constant “field (mT)”.
Configuration
Filter list
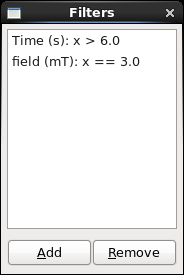
The filter list displays all existing filters.

Filters can be added with the “Add” button, permanently removed with the “Remove” button, and edited by double-clicking on the respective row.
Filter editor
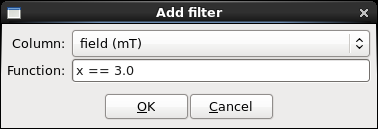
The filter editor allows the user to create new filters and to edit existing filters.

The given filter is added to the selected column.
If there is an error in the input, the user is informed. For example, the filter “y == 5” results in the message “name ‘y’ is not defined”.