Measurement configuration
The measurement configuration dialogs are used to set up input variables for an application.
Note
If the plots cannot be displayed (most likely due to a required plotting library not being installed), the plots and all plot-specific options will be omitted. However, the measurements can still be configured for acquisition.
Scalar measurement
A scalar measurement consists of a single data point for each point in time.
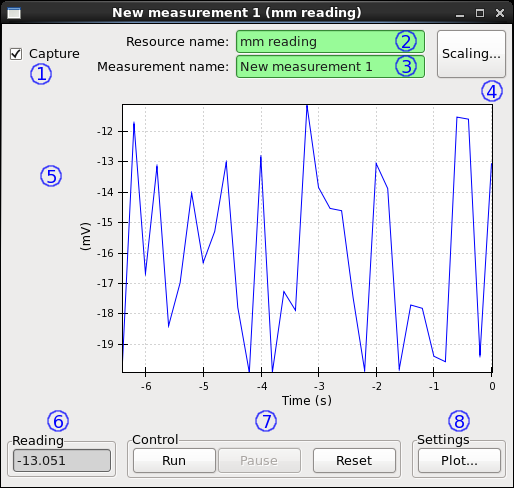
- Whether the measurement should be used during a sweep.
- The label of the resource from which this measurement should acquire data.
- A unique label to identify the measurement. This name appears, for example, as a column heading when capturing data.
- Resource scaling dialog.
- Historical view of the measurement.
- The last value read from the resource.
- “Run” and “Pause” control the live-view when there is no sweep in progress. “Reset” clears the historical view.
- Plot settings dialog.
Resource scaling
Resources can be scaled as desired after they come in from a device, but before they are used.
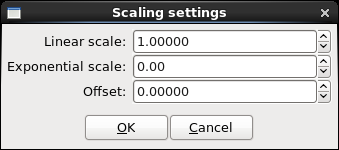
The resource used for the measurement is scaled according to the formula:
{new value} = {linear scale} * {old value} * 10 ^ {exponential scale} + {offset}
Note
This scaling affects the recorded and exported values as well as the displayed values.
Plot settings
The historical plot can be configured, or disabled outright.
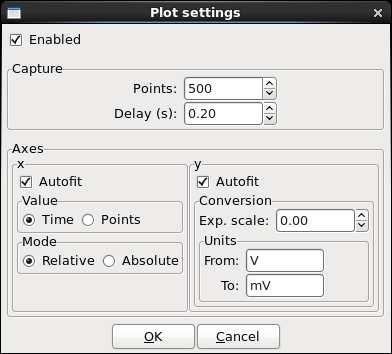
Enabled: Whether the plot should be updated at all.
Capture
- Points: The number of historical values to display. The maximum value is 10,000.
- Delay: In live-view mode, the delay between successive acquisitions. The minimum value is 200 ms.
Axes
x
- Autofit: Whether to automatically re-scale the x axis as values change.
- Value: The unit (time or data point number) along the x axis.
- Mode: Whether to use relative or absolute values.
y
Autofit: Whether to automatically re-scale the y axis as values change.
Conversion
Exp. scale: The incoming value is scaled according to the formula:
{new value} = {old value} * 10 ^ {exp scale}Units: The incoming units are assumed to be the “From” units and the displayed value is adjusted to match the “To” units.
Note
These conversion settings affect only the displayed values.
List measurement
A list measurement consists of a list of data point for each point in time.
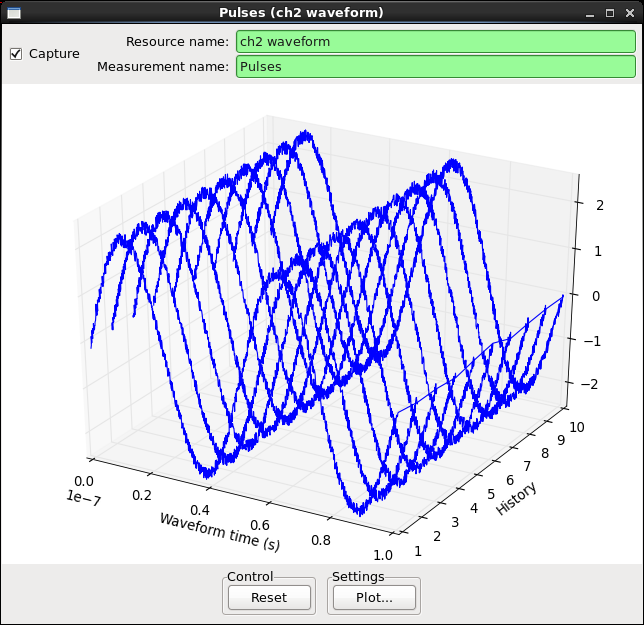
The list measurement configuration is identical to scalar measurement configuration, but with fewer options.
Plot settings
The historical plot can be configured, or disabled outright.
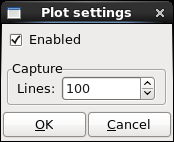
- Enabled: Whether the plot should be updated at all.
- Capture
- Lines: The number of lines of historical data to display.